Hypotheses Data and methods
Hypotheses
The afterschool program by providing tutoring service to student will help boost their performance at school. Our prediction is that the program will increase the GPA of students that attend the tutoring service.
Data and methods
Identification strategy
Measuring of improved grades
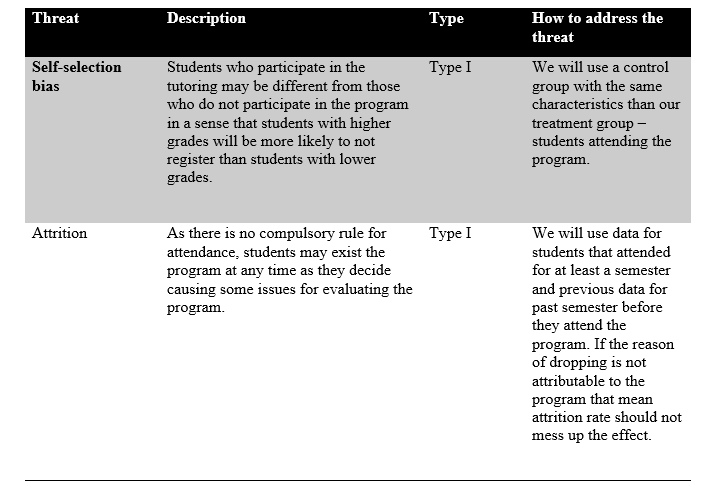
Improvement in grades is very straightforward and easily related with the attendance on the program in the way that one of its goals is the academic readiness of students. Based on our DAG, we know that the confounding nodes are Location, Background, and Ability to learn. In our program we operationalize Location as the distance from students ’home to school in miles. Background will be identified as the number of siblings students have and Ability to learn will be measured as their previous GPA before the program.
Our analysis approach will be Inverse Probability Weighing. We are going to assign every student some probability of enrolling in the afterschool tutoring program, and then weight each observation by its inverse probability. First, we generate scores which represent the probability of attending the afterschool tutoring program and second use a special formula to convert those scores into weights. Finally, we will use a regression model after incorporating in it the inverse probability weights we have found.
Data
Using administrative data from school administration/ school districts, we are going to perform statistical analysis focusing on specific variables. The variables that will be included in our dataset are the student ID (not their actual school ID), GPA (previous GPA before the program), Treatment (1 if student is attending the program and 0 if student does not attend), the Final GPA (after the program), Sibling (as a measure of background), and location (in miles).
Validity
Internal validity

External validity
